
Trending nonsense: WalletHub misuses Google Trends to track financial distress
WalletHub misuses Google Trends data to unreliably identify cities and states with the most people in financial distress

Everybody loves a list. Especially when the list is a ranking of the best and worst. Does my state consume the most ice cream? Do I live in the worst state for road traffic? Such rankings are entertaining, and they certainly grab our attention. But when rankings are for serious issues, they can distort our sense of reality. At worst, they become the basis for misguided policy.
Recently, I came across a pair of rankings on the personal finance site WalletHub, "States with the Most People in Financial Distress" and "Cities with the Most People in Financial Distress". They score each state and city for financial distress based on nine factors, such as bankruptcy filings and credit scores. The state rankings rate Texas as the worst, and Hawaii as the best. They're interesting, but also nonsense.
I'm not suggesting that Texas is in great shape, nor that Hawaii is in bad shape. But the presented data and methodology give us little reason to believe WalletHub's conclusions. There are multiple things wrong in the articles, but today I'll look at the articles' misuse of Google Trends. Both articles use the same methodology, so I'll focus on the article with state rankings.
What is Google Trends
Google Trends allows the public to see how often terms are searched on Google. The results are reported as comparisons rather than as absolute numbers. The highest number of hits for a time period is indexed to a value of 100, and the other numbers of hits are indexed relative to that peak. For example, the illustration below shows Google Trends results for the terms "ski" and "swim" during the five years from September, 2020 to September 2025. Each point corresponds to the number of searches made in one week.
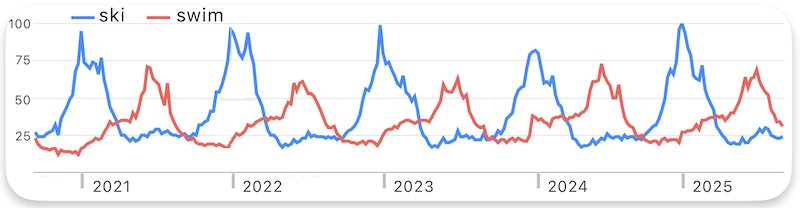
The most hits occurred for "ski" during the winter of 2024-2025, so that peak is indexed to 100. The number of hits for "swim" that week was about 25% of those for "ski", so the value of "swim" for that week is 25.
These numbers are an approximation. The relative amounts are not based on all searches, but only on a sample. Repeated requests can give different results. As Google explains on their Trends FAQ, "Providing access to the entire data set would be too large to process quickly." I ran the same search again on Trends, and the numbers for that week were slightly different: 98 for "ski" and 26 for "swim".
Though Google doesn't reveal the actual number of searches for the terms, it does appear that, in the middle of winter, there are about four times as many searches for "ski" than there are for "swim". The trend reverses in the summer, and "swim" is searched about three times more often than "ski". Hardly surprising. We can even see that searches for "ski" were down during the winter of 2023-2024, possibly because snowfall across the country was well below average that year.
This suggests that the Trends tool can give us insights and, help us predict patterns, such as in purchasing and voting. For example, if searches for "ski" are greater than usual this fall, perhaps manufacturers of ski equipment should ramp up production.
So, back to the article on financial distress, which uses the Trends ratings of "debt" and "loans" as part of its calculations. WalletHub states that Texans "search Google for 'debt' and 'loans' at a high rate, which shows that many people are desperate to borrow, despite already owing money." It's a bold claim. I'll go through three reasons to distrust their use of Trends results.
People search for different reasons
WalletHub assumes a strong connection between searching for "loans" and desperately needing one. Financial desperation is just one reason to search for loans. People buying houses might also search for loans. For example, South Carolina and Nevada are in the top ten states for "loans" searches. However, according to the realty site, Redfin, they ranked third and fourth in the country for the highest rates of home sales during the first quarter of 2025. Perhaps in those two states the searches were driven more by prosperity than distress.
Or, maybe loans are simply in the news. Here is the Trends graph for "loans" during the first quarter of 2025, the period WalletHub uses for their conclusions.
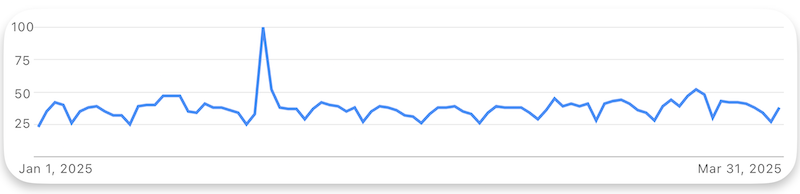
That big spike occurred on January 29, the day after an executive order, signed by President Trump, suspended the government's payment of trillions of dollars in loans and grants. Additionally, throughout the quarter, President Biden's statement, and then President Trump's actions, on student loans were frequently in the news. We don't know how much home sales, news stories, or financial distress drove searches for "loans", state by state, during that period.
Search terms matter
Even if search term trends can give us insight into financial distress, WalletHub's use of "debt" and "loans" isn't justified. I compared "loans" to the singular form, "loan", on Trends during the same three months WalletHub used. "Loan" gave results quite different from "loans". For example, WalletHub reported that Texas came in 5th on searches for "loans". I found that Texas was 14th for "loan". Had they used the singular form, Texas would not have appeared to be so singularly bad. On the other hand, West Virginia fared much worse, moving from 38th for "loans" up to 9th for "loan".
I asked WalletHub how they determined that searches for "debt" and "loans" were good indicators of financial distress. I also asked why they used "loans" rather than "loan". Here is their reply:
General insights into loan-related Google searches and lending trends show that "loans" in the plural tend to represent the broader category more commonly discussed in finance and consumer contexts, such as personal loans, mortgage loans, auto loans, etc. Articles and data tend to use "loans" when referring to overall borrowing and debt trends.
While "loans" is how one would refer collectively to the various types of loans, it doesn't follow that "loans" is necessarily more likely to be used than "loan" by people in financial distress. "Loan" was searched over twice as much as "loans" during Q1 of 2025. "Mortgage loan" was searched almost five times as much as "mortgage loans", and "auto loan" was searched about six times as much as "auto loans".
WalletHub's ranking of states is highly sensitive to the choice of search terms, and the choice makes a big difference. And, there are more problems.
Google Trends results are not always reliable
As I mentioned above, Trends results are not entirely consistent. Though several requests for "ski" and "swim" gave slightly different results, repeated requests for "debt" and "loans" gave widely varying results. For example, WalletHub put Oklahoma in a three-way tie for 6th place on "debt" searches. I ran 20 tests for the same time period that WalletHub tested, the first quarter of 2025. Several of those tests put Oklahoma in 7th place, closely matching WalletHub's results. But, in some tests, Oklahoma dropped down to 46th place. Here are some of the states that varied the most in rank across the Trends samples for "debt".
- Oklahoma ranked 6 - 46
- Arkansas ranked 3 - 34
- Texas ranked 1 - 29
- Nevada ranked 11 - 38
- North Carolina ranked 5 - 32
Every state, except for Hawaii (consistently at 50th place), had rankings that differed from WalletHub's in some tests. Here are all the states, with WalletHub's rankings for "debt" search represented with a point, and the range of rankings from my 20 tests represented by a bar. You can hover over the points to see the numbers.
WalletHubUnited Stats | |
| Indiana | Indiana WalletHub: 1 United Stats: 4 - 13 |
| North Dakota | North Dakota WalletHub: 2 United Stats: 1 - 2 |
| Virginia | Virginia WalletHub: 3 United Stats: 8 - 26 |
| New York | New York WalletHub: 4 United Stats: 2 - 11 |
| South Dakota | South Dakota WalletHub: 4 United Stats: 4 - 8 |
| Wyoming | Wyoming WalletHub: 6 United Stats: 2 - 7 |
| Arizona | Arizona WalletHub: 6 United Stats: 2 - 8 |
| Oklahoma | Oklahoma WalletHub: 6 United Stats: 7 - 46 |
| Utah | Utah WalletHub: 9 United Stats: 8 - 15 |
| Ohio | Ohio WalletHub: 10 United Stats: 4 - 20 |
| Montana | Montana WalletHub: 11 United Stats: 8 - 14 |
| Nevada | Nevada WalletHub: 11 United Stats: 14 - 38 |
| Texas | Texas WalletHub: 13 United Stats: 1 - 29 |
| Missouri | Missouri WalletHub: 13 United Stats: 3 - 14 |
| Washington | Washington WalletHub: 13 United Stats: 20 - 38 |
| Michigan | Michigan WalletHub: 16 United Stats: 2 - 12 |
| Arkansas | Arkansas WalletHub: 16 United Stats: 3 - 34 |
| Alaska | Alaska WalletHub: 16 United Stats: 8 - 20 |
| Georgia | Georgia WalletHub: 16 United Stats: 14 - 34 |
| Idaho | Idaho WalletHub: 16 United Stats: 19 - 24 |
| Illinois | Illinois WalletHub: 16 United Stats: 19 - 36 |
| Kansas | Kansas WalletHub: 22 United Stats: 2 - 15 |
| Tennessee | Tennessee WalletHub: 22 United Stats: 3 - 16 |
| South Carolina | South Carolina WalletHub: 22 United Stats: 7 - 23 |
| Louisiana | Louisiana WalletHub: 22 United Stats: 19 - 33 |
| Delaware | Delaware WalletHub: 22 United Stats: 22 - 33 |
| Alabama | Alabama WalletHub: 27 United Stats: 1 - 27 |
| Colorado | Colorado WalletHub: 27 United Stats: 14 - 36 |
| Pennsylvania | Pennsylvania WalletHub: 27 United Stats: 15 - 29 |
| Kentucky | Kentucky WalletHub: 27 United Stats: 23 - 34 |
| Minnesota | Minnesota WalletHub: 27 United Stats: 27 - 40 |
| North Carolina | North Carolina WalletHub: 32 United Stats: 5 - 21 |
| Maryland | Maryland WalletHub: 32 United Stats: 19 - 33 |
| Florida | Florida WalletHub: 32 United Stats: 19 - 35 |
| West Virginia | West Virginia WalletHub: 32 United Stats: 26 - 36 |
| Wisconsin | Wisconsin WalletHub: 36 United Stats: 14 - 46 |
| New Jersey | New Jersey WalletHub: 36 United Stats: 19 - 40 |
| Iowa | Iowa WalletHub: 38 United Stats: 21 - 37 |
| Maine | Maine WalletHub: 38 United Stats: 34 - 39 |
| Rhode Island | Rhode Island WalletHub: 40 United Stats: 31 - 41 |
| New Hampshire | New Hampshire WalletHub: 40 United Stats: 38 - 41 |
| Massachusetts | Massachusetts WalletHub: 42 United Stats: 31 - 45 |
| Nebraska | Nebraska WalletHub: 42 United Stats: 40 - 43 |
| California | California WalletHub: 42 United Stats: 40 - 46 |
| Connecticut | Connecticut WalletHub: 45 United Stats: 32 - 47 |
| Mississippi | Mississippi WalletHub: 46 United Stats: 44 - 47 |
| Oregon | Oregon WalletHub: 47 United Stats: 43 - 46 |
| Vermont | Vermont WalletHub: 48 United Stats: 47 - 48 |
| New Mexico | New Mexico WalletHub: 49 United Stats: 48 - 49 |
| Hawaii | Hawaii WalletHub: 50 United Stats: 50 - 50 |
1 50
| |
I asked WalletHub if they took multiple samples from Trends, or just one. They replied, "When we use Google Trends we use the result from a single request." This means their Trends scores are almost meaningless. And since 1/3 of their overall scores are based on Trends scores, the conclusions of their article are unreliable.
It's possible to partially offset Trends' variability by averaging the results from multiple tests. However, in this case, that might not have been much better. As the authors of "The (Mis)use of Google Trends Data in the Social Sciences" wrote, "If the values differ strongly between samples or even trend in opposite directions, researchers should seriously reconsider using Google Trends as a data source at all."
Is Google Trends useless?
Given the uncertainty around why people search, how the choice of search terms affects the results, and the lack of reliability in results, is Google Trends useless? Not if used properly. The results for "ski" and "swim" clearly align with seasonal interest. However, in a study of Google Trends' ability to detect disease outbreaks, "Is Google Trends a Reliable Tool for Digital Epidemiology?", the authors concluded that, "Overall, Google Trends seems to be more influenced by the media clamor than by true epidemiological burden." In other words, when there are a lot of searches for "flu", we can only conclude that a lot of people are talking about flu.
We find numbers compelling. And getting numbers from Trends is quick and easy. But a responsible use of Trends starts with establishing a strong correlation between search terms and social phenomena, and only then using its results as a measure.
Why this matters
Many sites republished WalletHub's content. According to Ahrefs, as of August 23, 339 sites link to the WalletHub article ranking states, including Newsweek, Bloomberg, New York Post, and many affiliate stations of Fox, CBS, and ABC. Also from Ahrefs, 291 sites link to the WalletHub article comparing cities. Moneywise repeatedly cites the supposed significance of the Trends results in their summary of the article ranking states, including this headline:
Florida is now one of the most financially distressed states – 2nd only to this 1 Southern state, where people are most likely to Google these 2 words
and in this comment about Hawaii being the least financially distressed state:
Unlike Texas, it was the state with the fewest number of people searching Google for "debt" and "loans."
These rankings matter. Even the slimmest difference between first and second place can determine who sees the rankings and how they interpret them. There's a preponderance of references from the states at the top of the lists, including Texas and Florida. Articles such as WalletHub's spread misinformation. This can affect how people vote, which in turn determines public policies.
Would WalletHub's rankings of states and cities be more reliable without the use of Google Trends? Not really. There are other problems with their methodology. For example, they factor in changes in values over time, such as the change in the number of bankruptcy filings. In a state or city with few bankruptcies, a few more look like a lot compared to a state or city that regularly has a large number of bankruptcies.
Analogously, a couple having their first child grows their family by 50%. If their neighbors, a family of eight, add twins, that family only grows by 25%. By WalletHub's reasoning, the family of three is larger than the family of ten.